
Amazon CloudWatch
Please use the menu below to navigate the article sections:
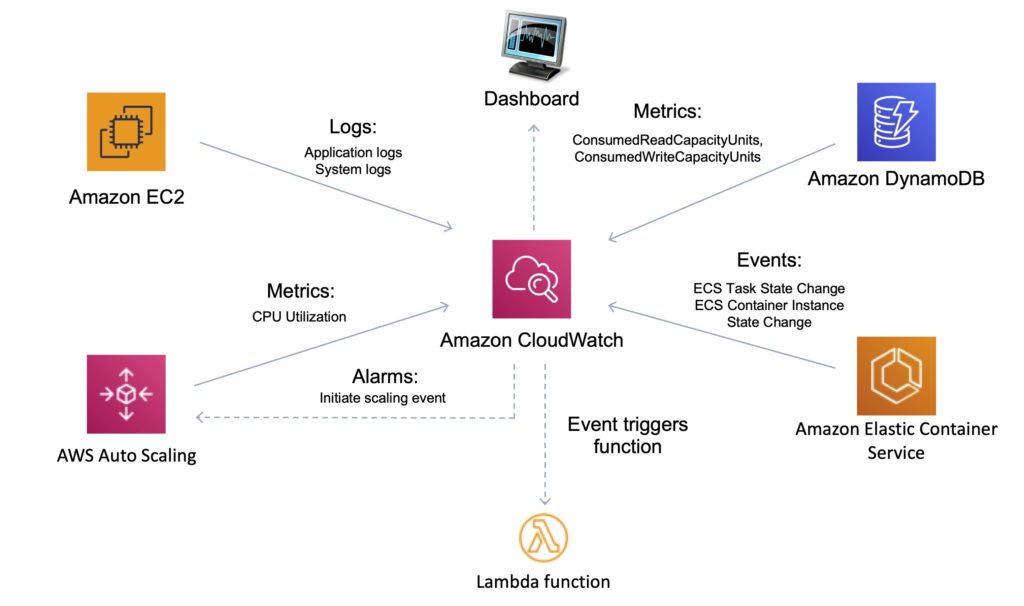
Amazon CloudWatch is a monitoring service for AWS cloud resources and the applications you run on AWS.
CloudWatch is used to collect and track metrics, collect, and monitor log files, and set alarms.
With CloudWatch you can:
- Gain system-wide visibility into resource utilization.
- Monitor application performance.
- Monitor operational health.
CloudWatch alarms monitor metrics and can be configured to automatically initiate actions.
CloudWatch Logs centralizes logs from systems, applications, and AWS services.
CloudWatch Events delivers a stream of system events that describe changes in AWS resources.
CloudWatch is accessed via API, command-line interface, AWS SDKs, and the AWS Management Console.
CloudWatch integrates with AWS IAM.
CloudWatch can automatically react to changes in your AWS resources.
With CloudWatch you can monitor resources such as:
- EC2 instances.
- DynamoDB tables.
- RDS DB instances.
- Custom metrics generated by applications and services.
- Any log files generated by your applications.
CloudWatch retains metric data as follows:
- Data points with a period of less than 60 seconds are available for 3 hours. These data points are high-resolution custom metrics.
- Data points with a period of 60 seconds (1 minute) are available for 15 days.
- Data points with a period of 300 seconds (5 minute) are available for 63 days.
- Data points with a period of 3600 seconds (1 hour) are available for 455 days (15 months).
Amazon CloudWatch vs AWS CloudTrail:
| CloudWatch | CloudTrail |
| Performance monitoring | Auditing |
| Log events across AWS Services – think operations | Log API activity across AWS services – think activities, or who to blame |
| Higher-level comprehensive monitoring and event service | More low-level, granular |
| Log from multiple accounts | Log from multiple accounts |
| Logs stored indefinitely | Logs stored to S3 or CloudWatch indefinitely |
| Alarms history for 14 days | No native alarming; can use CloudWatch alarms |
Metrics
Metrics are the fundamental concept in CloudWatch.
A metric represents a time-ordered set of data points that are published to CloudWatch.
AWS services send metrics to CloudWatch.
You can also send your own custom metrics to CloudWatch.
Metrics exist within a region.
Metrics cannot be deleted but automatically expire after 15 months.
Metrics are uniquely defined by a name, a namespace, and zero or more dimensions.
CloudWatch retains metric data as follows:
- Data points with a period of less than 60 seconds are available for 3 hours. These data points are high-resolution custom metrics.
- Data points with a period of 60 seconds (1 minute) are available for 15 days.
- Data points with a period of 300 seconds (5 minute) are available for 63 days.
- Data points with a period of 3600 seconds (1 hour) are available for 455 days (15 months).
Custom Metrics
You can publish your own metrics to CloudWatch using the AWS CLI or an API.
You can view statistical graphs of your published metrics with the AWS Management Console.
CloudWatch stores data about a metric as a series of data points.
Each data point has an associated time stamp.
You can even publish an aggregated set of data points called a statistic set.
High-Resolution Metrics
Each metric is one of the following:
- Standard resolution, with data having a one-minute granularity
- High resolution, with data at a granularity of one second
Metrics produced by AWS services are standard resolution by default.
When you publish a custom metric, you can define it as either standard resolution or high resolution.
When you publish a high-resolution metric, CloudWatch stores it with a resolution of 1 second, and you can read and retrieve it with a period of 1 second, 5 seconds, 10 seconds, 30 seconds, or any multiple of 60 seconds.
High-resolution metrics can give you more immediate insight into your application’s sub-minute activity.
Keep in mind that every PutMetricData call for a custom metric is charged, so calling PutMetricData more often on a high-resolution metric can lead to higher charges.
If you set an alarm on a high-resolution metric, you can specify a high-resolution alarm with a period of 10 seconds or 30 seconds, or you can set a regular alarm with a period of any multiple of 60 seconds.
There is a higher charge for high-resolution alarms with a period of 10 or 30 seconds.
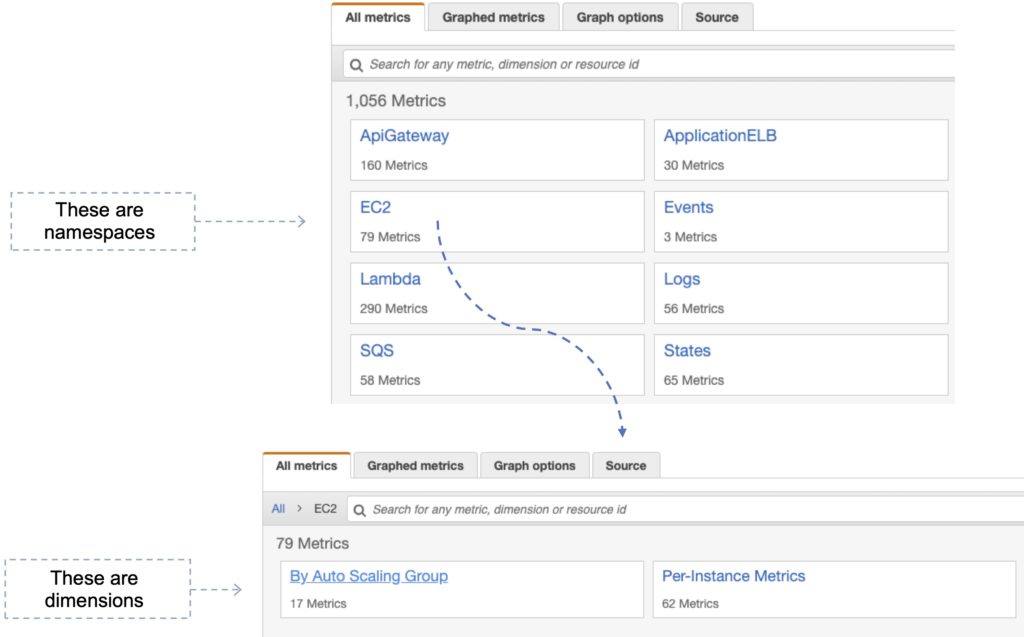
Namespace
A namespace is a container for CloudWatch metrics.
Metrics in different namespaces are isolated from each other, so that metrics from different applications are not mistakenly aggregated into the same statistics.
The following table provides some examples of namespaces for several AWS services:
| Service | Namespace |
| Amazon API Gateway | AWS/ApiGateway |
| Amazon CloudFront | AWS/CloudFront |
| AWS CloudHSM | AWS/CloudHSM |
| Amazon CloudWatch Logs | AWS/Logs |
| AWS CodeBuild | AWS/CodeBuild |
| Amazon Cognito | AWS/Cognito |
| Amazon DynamoDB | AWS/DynamoDB |
| Amazon EC2 | AWS/EC2 |
| AWS Elastic Beanstalk | AWS/ElasticBeanstalk |
Dimensions
In custom metrics, the –dimensions parameter is common.
A dimension further clarifies what the metric is and what data it stores.
You can have up to 10 dimensions in one metric, and each dimension is defined by a name and value pair.
How you specify a dimension is different when you use different commands.
With put-metric-data, you specify each dimension as MyName=MyValue, and with get-metric-statistics or put-metric-alarm you use the format Name=MyName, Value=MyValue.
For example, the following command publishes a Buffers metric with two dimensions named InstanceId and InstanceType.
aws cloudwatch put-metric-data –metric-name Buffers –namespace MyNameSpace –unit Bytes –value 231434333 –dimensions InstanceId=1-23456789,InstanceType=m1.small
This command retrieves statistics for that same metric. Separate the Name and Value parts of a single dimension with commas, but if you have multiple dimensions, use a space between one dimension and the next.
aws cloudwatch get-metric-statistics –metric-name Buffers –namespace MyNameSpace –dimensions Name=InstanceId,Value=1-23456789 Name=InstanceType,Value=m1.small –start-time 2016-10-15T04:00:00Z –end-time 2016-10-19T07:00:00Z –statistics Average –period 60
If a single metric includes multiple dimensions, you must specify a value for every defined dimension when you use get-metric-statistics. For example, the Amazon S3 metric BucketSizeBytes includes the dimensions BucketName and StorageType, so you must specify both dimensions with get-metric-statistics.
aws cloudwatch get-metric-statistics –metric-name BucketSizeBytes –start-time 2017-01-23T14:23:00Z –end-time 2017-01-26T19:30:00Z –period 3600 –namespace AWS/S3 –statistics Maximum –dimensions Name=BucketName,Value=MyBucketName Name=StorageType,Value=StandardStorage –output table
Publishing Single Data Points
To publish a single data point for a new or existing metric, use the put-metric-data command with one value and time stamp.
For example, the following actions each publish one data point.
aws cloudwatch put-metric-data –metric-name PageViewCount –namespace MyService –value 2 –timestamp 2016-10-20T12:00:00.000Z
aws cloudwatch put-metric-data –metric-name PageViewCount –namespace MyService –value 4 –timestamp 2016-10-20T12:00:01.000Z
aws cloudwatch put-metric-data –metric-name PageViewCount –namespace MyService –value 5 –timestamp 2016-10-20T12:00:02.000Z
Statistics
Statistics are metric data aggregations over specified periods of time.
CloudWatch provides statistics based on the metric data points provided by your custom data or provided by other AWS services to CloudWatch.
| Statistic | Description |
| Minimum | The lowest value observed during the specified period. You can use this value to determine low volumes of activity for your application. |
| Maximum | The highest value observed during the specified period. You can use this value to determine high volumes of activity for your application. |
| Sum | All values submitted for the matching metric added together. This statistic can be useful for determining the total volume of a metric. |
| Average | The value Sum/SampleCount during the specific period. By comparing this statistic with the Minimum and Maximum you can determine the full scope of a metric and how close the average is to the Minimum and Maximum. This comparison helps you know when to increase or decrease your resources as needed. |
| SampleCount | The count (number) of data points used for the statistical calculation. |
| pNN.NN | The value of the specified percentile. You can specify and percentile using up to two decimal places (e.. p45.45). Percentile statistics are not available for metric that include negative values. For more information see Percentiles. |
CloudWatch Alarms
You can use an alarm to automatically initiate actions on your behalf.
An alarm watches a single metric over a specified time period, and performs one or more specified actions, based on the value of the metric relative to a threshold over time.
The action is a notification sent to an Amazon SNS topic or an Auto Scaling policy.
You can also add alarms to dashboards.
Alarms invoke actions for sustained state changes only.
CloudWatch alarms do not invoke actions simply because they are in a particular state.
The state must have changed and been maintained for a specified number of periods.
CloudWatch Logs
Amazon CloudWatch Logs lets you monitor and troubleshoot your systems and applications using your existing system, application, and custom log files.
You can use Amazon CloudWatch Logs to monitor, store, and access your log files from Amazon Elastic Compute Cloud (Amazon EC2) instances, AWS CloudTrail, Route 53, and other sources.
Features:
- Monitor logs from Amazon EC2 instances – monitors application and system logs and can trigger notifications.
- Monitor CloudTrail Logged Events – alarms can be created in CloudWatch based on API activity captured by CloudTrail.
- Log retention – by default, logs are retained indefinitely. Configurable per log group from 1 day to 10 years.
CloudWatch Logs can be used for real time application and system monitoring as well as long term log retention.
CloudTrail logs can be sent to CloudWatch Logs for real-time monitoring.
CloudWatch Logs metric filters can evaluate CloudTrail logs for specific terms, phrases, or values.
Export to S3 possible with CreateExportTask – takes 21 hours.
For near real-time or persistent logs use Kinesis Firehose.
Use Firehose for any Firehose supported destinations.
For real-time use Lambda or Kinesis Data Stream with KCL consumers.
Use a metric filter for scanning log data which generates a CloudWatch metric.
Subscription filters can be created for sending data to a subscriber.
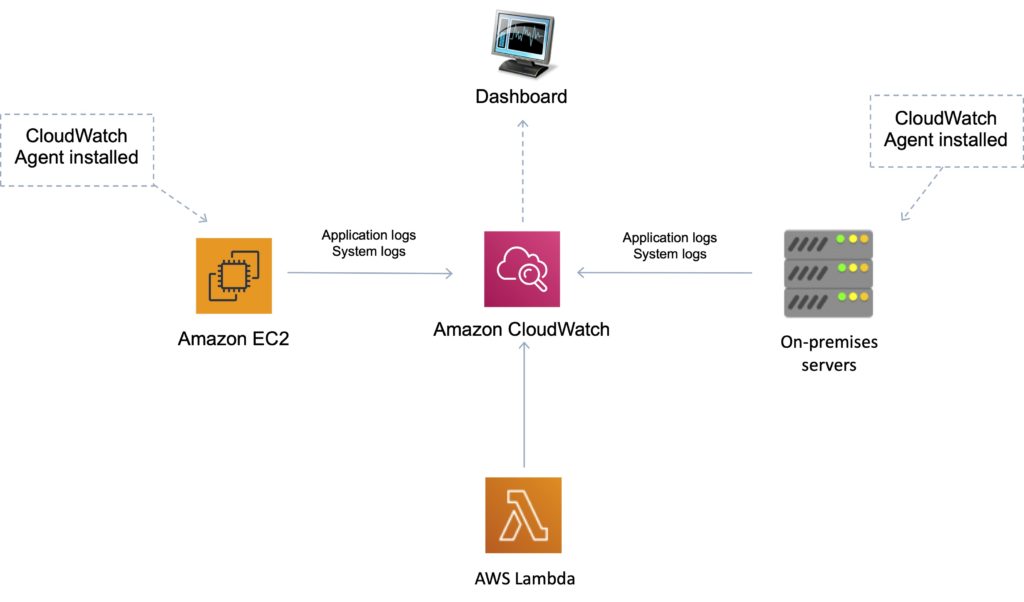
CloudWatch Logs Agent
The CloudWatch Logs agent provides an automated way to send log data to CloudWatch Logs from Amazon EC2 instances.
There is now a unified CloudWatch agent that collects both logs and metrics.
The unified CloudWatch agent includes metrics such as memory and disk utilization.
The unified CloudWatch agent enables you to do the following:
- Collect more system-level metrics from Amazon EC2 instances across operating systems. The metrics can include in-guest metrics, in addition to the metrics for EC2 instances.
- Collect system-level metrics from on-premises servers. These can include servers in a hybrid environment as well as servers not managed by AWS.
- Retrieve custom metrics from your applications or services using the StatsD and collectd protocols.
CloudWatch Events
Amazon CloudWatch Events delivers a near real-time stream of system events that describe changes in AWS resources.
Can use CloudWatch Events to schedule automated actions that self-trigger at certain times using cron or rate expressions
Can match events and route them to one or more target functions or streams.
Targets include:
- Amazon EC2 instances.
- AWS Lambda functions.
- Streams in Amazon Kinesis Data Streams.
- Delivery streams in Amazon Kinesis Data Firehose.
- Log groups in Amazon CloudWatch Logs.
- Amazon ECS tasks.
- Systems Manager Run Command.
- Systems Manager Automation.
- AWS Batch jobs.
- Step Functions state machines.
- Pipelines in CodePipeline.
- CodeBuild projects.
- Amazon Inspector assessment templates.
- Amazon SNS topics.
- Amazon SQS queues.
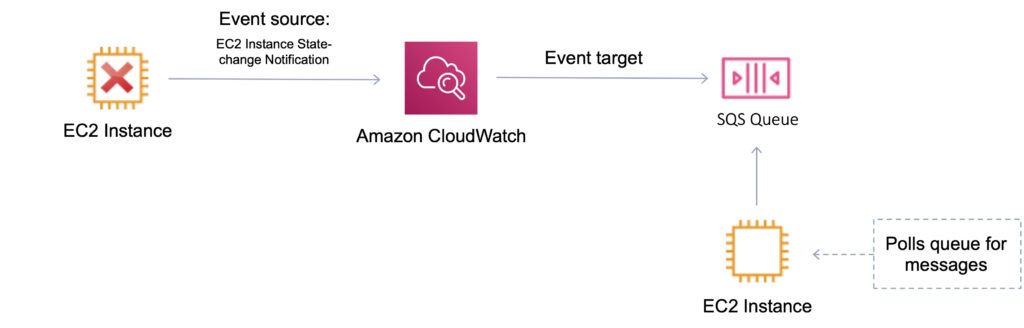
In the following example, an EC2 instance changes state (terminated) and the event is sent to CloudWatch Events which forwards the event to the target (SQS queue).
Useful API Actions
It is useful to understand the following API actions for the Developer Associate exam. You should check these out and other API actions on the AWS website as well prior to your exam.
GetMetricData
- Retrieve as many as 500 different metrics in a single request.
PutMetricData
- Publishes metric data points to Amazon CloudWatch.
- CloudWatch associates the data points with the specified metric.
- If the specified metric does not exist, CloudWatch creates the metric.
GetMetricStatistics
- Gets statistics for the specified metric.
- CloudWatch aggregates data points based on the length of the period that you specify.
- Maximum number of data points returned from a single call is 1,440.
PutMetricAlarm